What is Internet of Things?
In the last 2 years there has been an increased use in the IT industry of the term Internet of Things (IoT). But What Is the Internet of Things? The Internet of Things is the ever-growing interconnection of physical objects, uniquely identifiable that feature an IP address for internet connectivity. IoT will offer advanced connectivity to devices of any kind (washing machines, bracelets, glasses, fridges, etc). The expectation is that the interconnection of this devices will trigger automation in all fields enabling more advanced concepts as Smart Grids, Smart Cities and Artificial Intelligence.
Gartner predicts, there will be nearly 26 billion devices on the Internet of Things by 2020. The amount of different possibilities for this technologies are still uncertain, but for sure, this devices will generate and unprecedented amount of data, that will requiere the use of smart analytics for their interpretation.
Dashboard Software for IoT – Freeboard

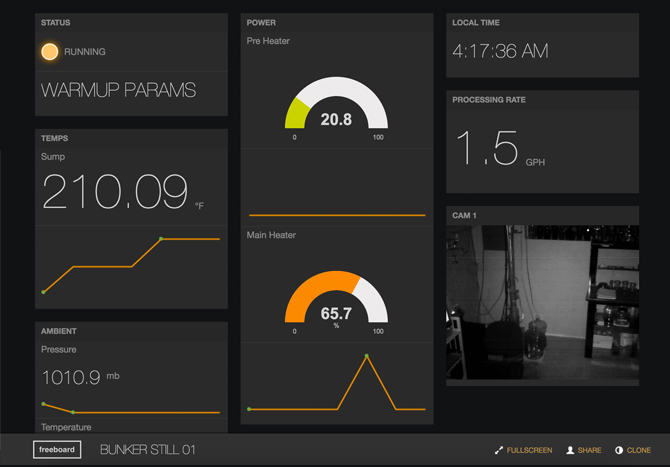
This post will describe one of the firsts cloud applications today that enables IoT data tracking through a Dashboard interface. This application is called Freeboard. Freeboard is a simple web application, which tracks devices data through the use of HTML, javascript and HTTP. The interface is simple, the Dashboard components are illustrative and easy to use. The device connections is straightforward and the information flow is amazingly fast.
Subscribe to Freeboard
You can subscribe to Freeboard Dashboard software for free, but its business model is monetised through subscriptions. You can create an account login or use your social media account (twitter, facebook). The Free account allow the user to register unlimited number of devices, use unlimited Dashboard widgets and create unlimited Dashboards. If you dont have any security concern about your IoT Data, is more than enough. The pricing options differentiate mainly in pre created Dashboard Templates and of course, the number of private Dashboards.
Configure Devices
Once you create your account, a tutorial will popup guiding you to start connecting devices into the web interface (through a QR code or just a url). This information will be available to the dashboards.
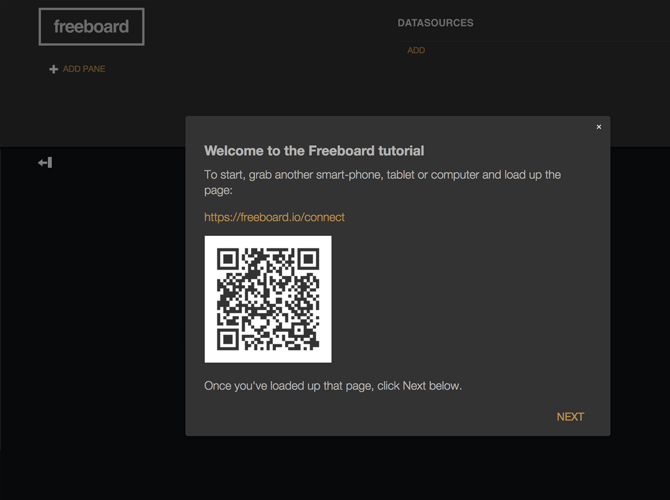
In this example I connected by Android Device to the URL, just entering it in the Chrome browser:
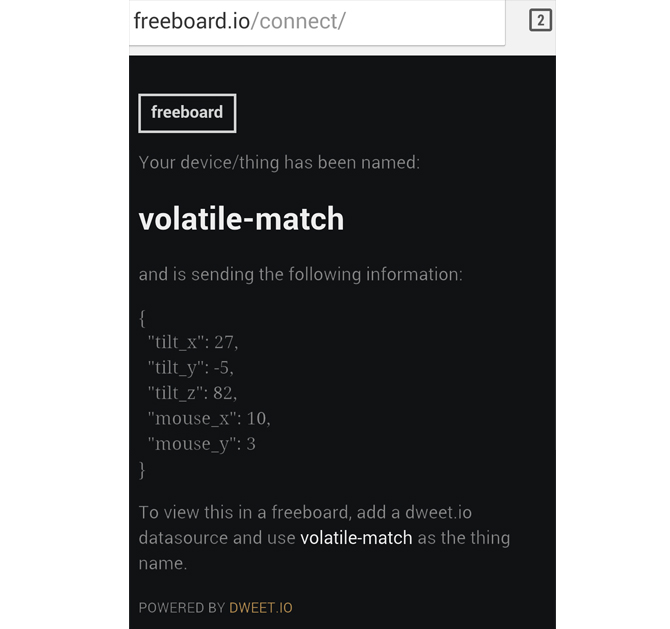
As soon as the device connects to freeboard it starts broadcasting the information as the accelerometer coordinates (X, Y, Z) and the mouse position (in this case being a smartphone with touchscreen the places the user touches the screen).
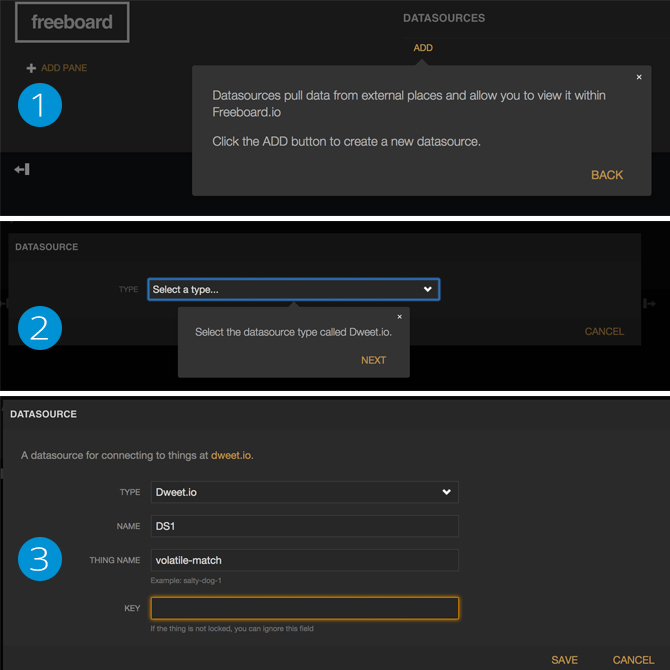
Create the Datasource in the Data Dashboard
The next step consists of creating the datasource in the Dashboard Software once you have your account created. The process only requires 3 steps. Create the Data Source (DS) with a name, select the type (in this case Deewt.io) and finally Naming the DS and the device that will represent. You can see that the interface names “thing” the device.
Create Dashboard Widgets
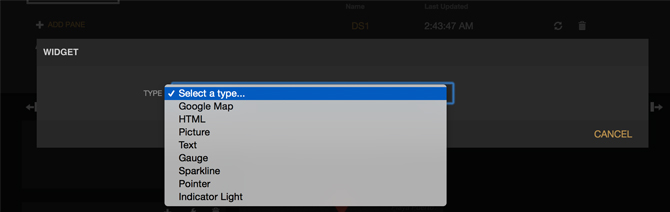
Once you have configured your devices, you can start creating your Dashboard Widgets.Each Widget will represent a data point of your Data Dashboard. The widgets options provided by the Dashboard Sofware are:
- Google Map
- HTML
- Picture
- Text
- Gauge
- Sparkline
- Pointer
- Indicator Light
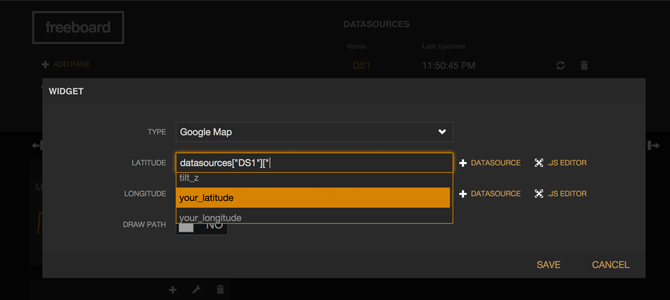
In this case, considering that the device is a smartphone, the example will contain a Sparkline widget (like a line chart) with mouse position data, a Gauge Widget for the X value of the accelerometer, and a Google Map widget with my latitude and longitude. The creation of the widget is as simple as Selecting the type, and the device variable to contemplate.
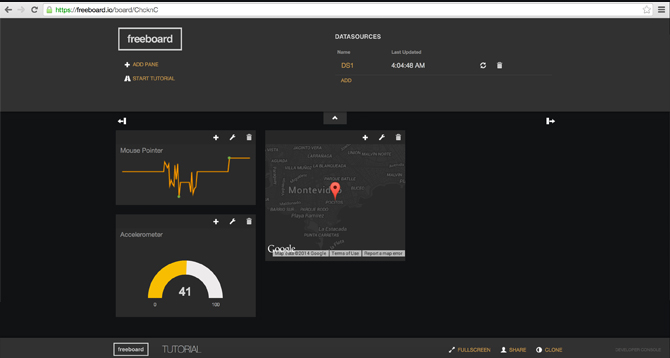
Dashboard View
Finally, after creating the three widget, and moving the device across the room, and tapping in the screen, I finally gathered some information that the Dashboard recorded.
Conclusions
Freeboard is a simple and modern Dashboard Software for IoT data. The configuration and use is extremely straightforward. The user can create customised dashboards of their IoT data, for example, the weather inside a room, taking information from a thermostat, from the humidity sensor, and the lighting conditions. This dashboards open a new windows of data analysis and innovation on the information we can process.